Cyclone-Tracks (Ensemble)
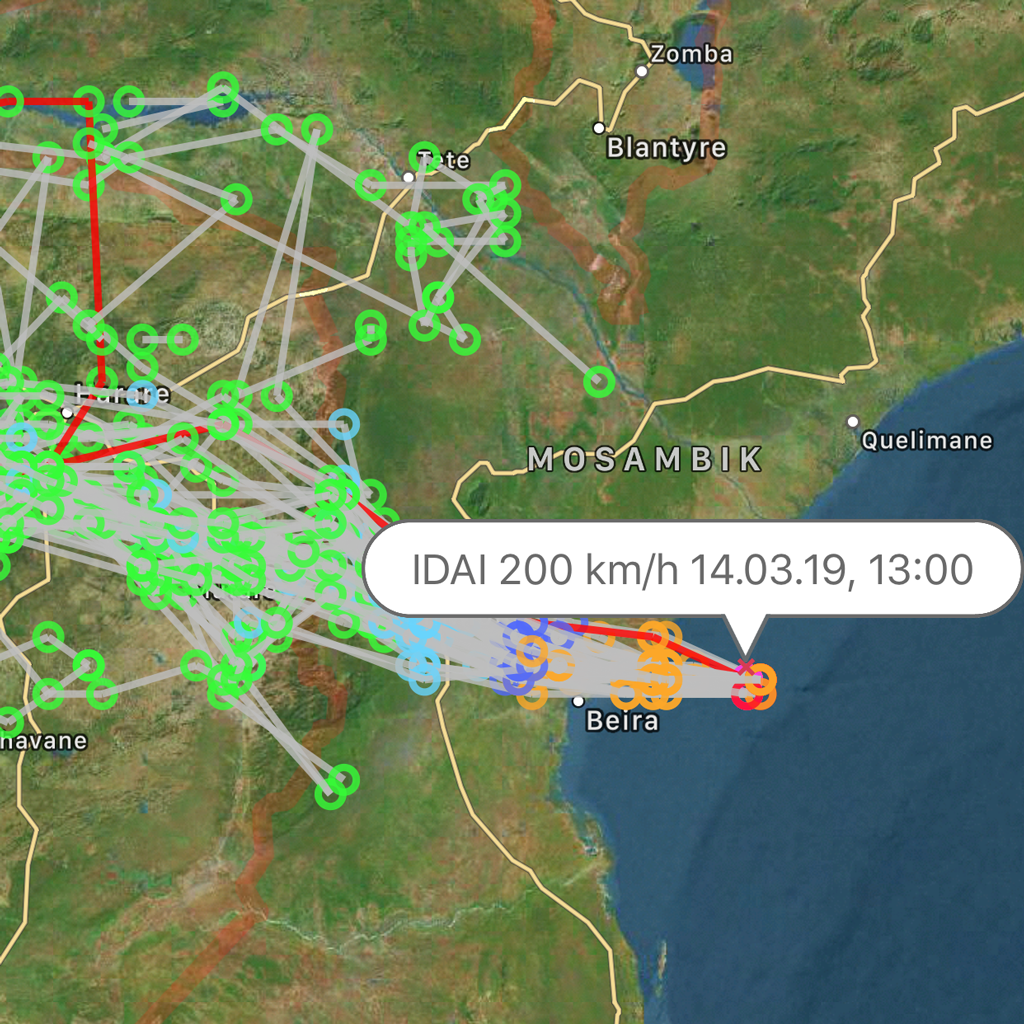
This map displays the forecast tracks of tropical cyclones according to the ECMWF’s EPS (ensemble prediction system). The color of each dot corresponds to the forecast intensity of a given tropical system at a given time by a given ensemble member. Use this map to get a sense of forecast uncertainty. If all the track lines are clustered closely together, you can have a high degree of confidence in the track forecast. If all the colors are the same, you can have a high degree of confidence in the intensity forecast. Do note however that the ensembles can underestimate the intensity of a very strong storm, especially in the near term. Expected maximum wind speed: green: < 39 mph, bright blue: 39-73 mph, blue: 74-95 mph, orange: 96-110 mph, red: 111-129 mph, magenta: 130-156 mph, pink: > 156 mph

Wirbelstürme (Ensemble)
Mit dem Tool "Wirbelstürme" (Cyclone tracks) kann die mögliche Zugbahn und Stärke von Wirbelstürmen (Hurrikans, Taifune, Zyklone) verfolgt werden. Die Prognose wird zwei mal täglich erneuert, jeweils gegen 08:30 UTC und gegen 20:30 UTC am Abend. Die verschiedenen Linien zeigen 52 Lösungen für die Zugbahn des jeweiligen Sturms. Liegen die Linien dicht beieinander, ist die Zugbahn recht sicher. Gehen sie dagegen sehr weit auseinander (in der Regel bei einer Prognose jenseits von 4 bis 5 Tagen) ist die Zugbahn noch völlig offen. Die Farbe deutet die maximale Geschwindigkeit des Windes an: Grün: < 62km/h, Hellblau: 62-86 km/h, Blau: 87-116 Km/h, Orange: 117-153 km/h, Rot: 154-183 km/h, Magenta 184-249 km/h, Rosa: >= 250 km/h